


Dow Theory is based on the foundational work of Charles Dow, considered the “Father of Technical Analysis.” Many of the tools we employ to better analyze market structure and investor sentiment, from trend analysis to index construction, are derived from Dow’s original essays from the early 20th century.
Dow compared two indexes to gauge the strength of the economy: the Dow Industrials which represented the producers of goods, and the Dow Railroads, which tracked the distributors of goods. If both of these indexes confirmed new highs, then economic conditions were strong and the markets were in a bullish phase.
In the modern age of financial analysis, when the Dow Industrials and Dow Transports (which evolved from the original railroad index) do not confirm a new high, we have a “bearish confirmation,” which indicates trend exhaustion. One of my guests this week on The Final Bar, Jeff Huge of JWH Investment Partners, highlighted this Dow Theory signal, leading us to dig deeper into the methodology. Today, we’ll walk through what this indicator implies for stocks in Q2, and also explore two more modern versions of Dow Theory.

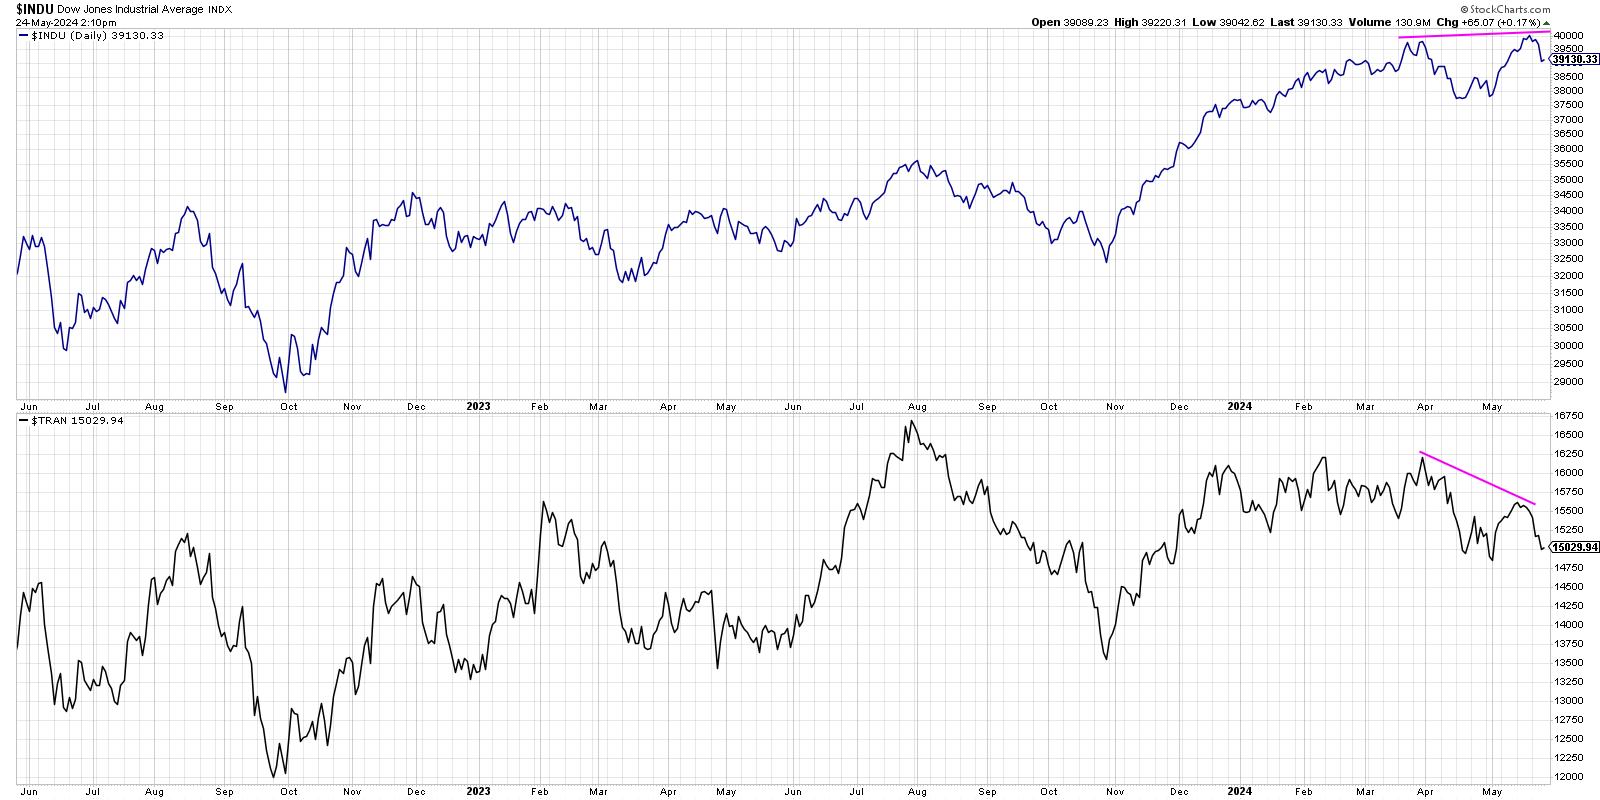
Here, we are showing the traditional version of Dow Theory, with the Dow Industrials in the top panel and the Dow Transports in the bottom panel. Note how the Dow Industrials made a new all-time high recently, pushing above 40,000 for the first time in history. Also note how the Dow Transports have not confirmed this recent high, actually trending lower over the last two months. Because only one of the indexes has made a new high, and that breakout was not confirmed by the other index, Dow would suggest that there is internal weakness in the market and a likely major market top.
Proponents of traditional Dow Theory would cite the long-term success of these signals, which have often provided an excellent early warning sign of danger ahead. Detractors would explain that the Dow Industrials index in 2024 includes lots of “non-industrial” names like banks and service companies. For example, technology stocks like Microsoft and Salesforce are part of the Dow Industrials! And companies like Amazon.com are not included in the Dow Transports, even though they have an exceptionally robust built-in distribution network.
So what else can we do to apply Dow’s theory in 2024? What about if we use the S&P 500 to represent the “old economy” names and the Nasdaq Composite to track the “new economy” companies?

When we go with this “New Dow Theory”, we realize that both the S&P 500 and Nasdaq Composite have already achieved new all-time highs in May 2024. So there is no bearish non-confirmation as we see with traditional Dow Theory. The problem with this approach? The mega-cap growth stocks dominate both of these market cap-weighted indexes! So we’re essentially double counting the largest names.
This has led to me to what I call the “Newer Dow Theory”, using equal-weighted indexes for the S&P 500 and the Nasdaq 100. This should effectively neutralize the mega-cap overweight, particularly in the S&P 500 index.

This is where things get a little more concerning for market bulls. While the S&P 500 has already made a new all-time high in Q2, the equal-weighted S&P is still below its March high. And the equal-weighted Nasdaq 100, while holding up quite well in recent weeks, has also failed to push to a new all-time high.
For now, this Newer Dow Theory comparison suggests market weakness, using Charles Dow’s simple analysis of market trends. As he determined over 120 years ago, an uptrend is a pattern of higher highs and higher lows. So, if the highs aren’t getting higher, the uptrend should be brought into question.
Thus, while traditional Dow Theory has already flashed a bearish signal, I’m watching this Newer Dow Theory as May transitions into June. If we get a bearish non-confirmation on this final chart, or if neither equal-weighted index manages to score another new high, market bears may be proven right as we enter the summer months!
RR#6,
Dave
P.S. Ready to upgrade your investment process? Check out my free behavioral investing course!
David Keller, CMT
Chief Market Strategist
StockCharts.com
Disclaimer: This blog is for educational purposes only and should not be construed as financial advice. The ideas and strategies should never be used without first assessing your own personal and financial situation, or without consulting a financial professional.
The author does not have a position in mentioned securities at the time of publication. Any opinions expressed herein are solely those of the author and do not in any way represent the views or opinions of any other person or entity.