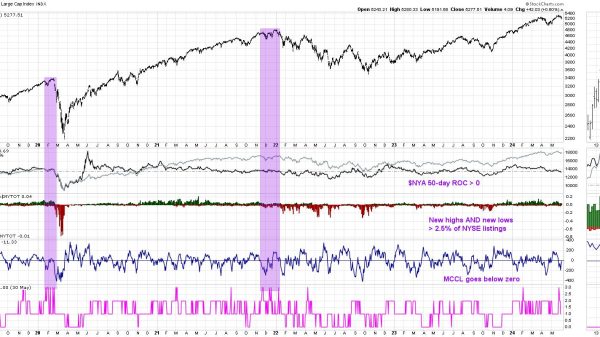


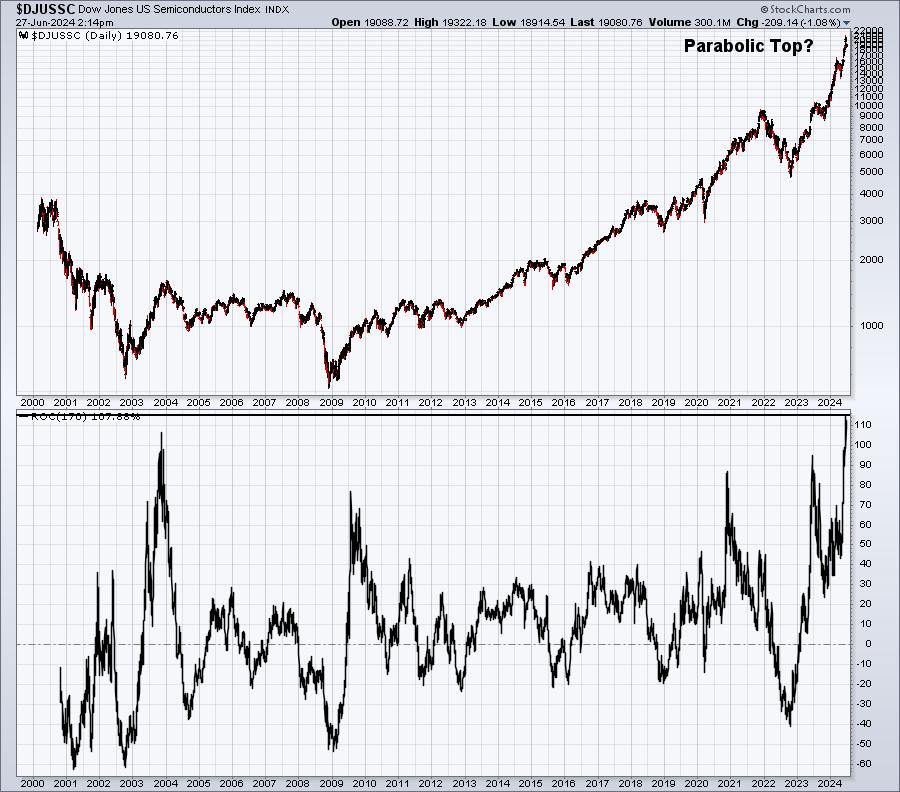
One hallmark of secular bull markets is rotation. When leading stocks, sectors, and industry groups falter, there needs to be others that grab the baton and help to keep the bull market intact. Semiconductors ($DJUSSC) have been the clear leader in the stock market for years, but especially since the end of October 2023, when the group embarked on its most powerful rally of the 21st century. Below is a 25-year chart of the DJUSSC. Pay particular note to the bottom panel, which reflects a 170-day rate of change (ROC), or roughly 8 months. Compare this most recent 8-month rally to other 8-month periods throughout this century:

The 8-month ROC recently hit 115%, which is the biggest rally EVER on this index. And if you look at the price chart, we should at least CONSIDER the possibility that this is a parabolic top. This is how these form – with tremendous amounts of positivity and what could end up being unsustainable revenue and EPS growth. The entire group is being priced off of record revenue and earnings growth and for perfection. Should traders even get a HINT that future growth might be lower than what we’ve been experiencing the past couple quarters, the semiconductor trade could be weak for months, possibly quarters.
In a secular bull market, however, it’s rotation that keeps our major indices in uptrends. Where might the new leadership emerge from if semiconductors do in fact weaken? Well, I think it’s already showing here:
XLC:

A breakout has already been made here. Yes, we’re a bit overbought, but nothing like how overbought technology (XLK) has been. One industry that typically revs up when the XLC is hot is internet ($DJUSNS). This group remains in the midst a major rally:
$DJUSNS:

The red-shaded area highlights the fact that, on relative basis, internet hasn’t been leading the past couple months. The breakout this week, though, might indicate renewed relative strength. It’s also noteworthy that since the financial-crisis low in 2009, internet stocks have been leaders during July, rising in 14 of the past 15 years:

The average July return has been 6.8%, more than double any other calendar month since 2009.
There’s one other key sector, consumer discretionary (XLY), that could play a big leadership role over the second half of 2024. This group has been a drag on U.S. equities, but it really hasn’t been felt that much, because the XLK has been so strong. NOW is the time, however, when U.S. equities could be looking for rotation to and leadership from this sector:
XLY:

Relative strength has begun to turn higher over the past two weeks and this relative strength could be fueled much further by an absolute breakout in the price of the XLY near the 184-185 level.
It’s been amazing what a stock like NVIDIA Corp (NVDA) has done for semiconductors, technology, and our major indices. But if NVDA struggles on a relative basis, which it certainly deserves, I see 3 critical stocks not named Apple (AAPL) and Microsoft (MSFT) that could swoop in and “save the day” for our major indices, especially the NASDAQ 100.
TAG, You’re It!
Ok, so if we’re going to need a replacement, temporary or otherwise, for a leadership stock like NVDA, which stock(s) might we look to for future leadership?
GOOGL:

Relative to its peers, GOOGL hit rock bottom in early March. Since then, GOOGL has been significantly outperforming its internet peers and is currently awaiting another one. From mid-May to mid-June, GOOGL didn’t go anywhere. Semiconductors were flying, but GOOGL took a back seat. Now that it’s latest breakout to all-time highs have occurred, it certainly appears as though GOOGL is well-prepared to take the baton for the next leg of this secular bull market.
AMZN:

I don’t know if there’s a better stock anywhere right now. AMZN is absolutely one of my favorites. Discretionary stocks have been lagging most of the year and AMZN is the top holding in the XLY. AMZN just broke out, after consolidating, on excellent volume and I expect the stock to be a leader during the 2nd half of 2024. AMZN’s best calendar month during this secular bull market (since 2013) has been July – check it out:

AMZN has climbed more often in November, but its actual average monthly performance in July (+7.3%) easily surpasses all other months. So we have technical conditions turning bullish just as we move into, arguably, AMZN’s best month.
TSLA:
Ok, I get it. TSLA’s been disappointing for sure. But there are improvements on the chart that suggest TSLA could be on the verge of a much bigger run. We do need to see one more key price level cleared to give me more confidence of a big rally:

I see rather significant improvement in momentum (PPO), volume trends, and relative strength. TSLA, relative to its auto peers, just hit nearly a 4-month high. This, combined with other technical improvements, tells me that we could just be getting started here. I do want to see gap resistance near 208 cleared, because after that, I don’t see any major resistance until 265 or so.
There’s one more thing to like. Over the past 6 years, June, July, and August have posted AMAZING average returns. This time of the year is when TSLA has really shown extreme absolute and relative strength. Check out this seasonality chart:

The average return during June, July, and August has been a STAGGERING and BLISTERING 43%!!! That’s the AVERAGE since 2019. So if TSLA is going to get the job done, history tells us that NOW is the time.
Remember, the sustainability of secular bull markets is not much different than the game we all played as kids. Hey AMZN, GOOGL, and TSLA! You’re IT!!!!
I published my first StockCharts YouTube video in quite awhile and it’s great to be back! I spent a lot of time discussing the beauty of secular bull markets and how rotation keeps them alive, providing areas to keep a close eye on for future leadership. Please be sure to check out the video HERE and also be sure to hit that “Like” button and “Subscribe” to the StockCharts YouTube channel! I’d really appreciate the support!
Happy trading!
Tom