


Breaking Down Into Growth / Value
Using Relative Rotation Graphs to help break down the US stock market into various segments can help us identify pockets of strength or weakness.
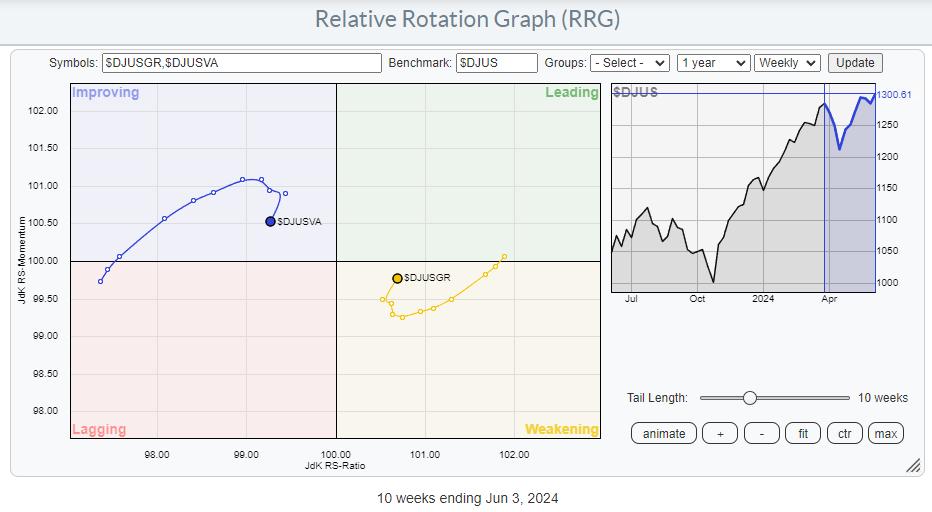
The first RRG below shows the relationship between value and growth stocks.

The first important observation is that the growth tail is still on the right-hand side of the graph, inside the weakening quadrant, while the value tail is on the left side of the graph, inside the improving quadrant. This indicates the continuing strength of growth stocks.
However, since mid-March, there has been a strong improvement for value stocks, which pushed the tail into the improving quadrant at a strong hanging. By default, the growth tail moved in the opposite direction into the weakening quadrant at a negative heading.
However, over the last three to four weeks, that temporary countertrend move seems to have ended, and the preference is now back to growth stocks.
Breaking Down Into Size
Another way to break down the US stock market is to use size segments: large-cap, mid-cap, and small-cap stocks.
The relative rotation graph below shows this breakdown and the rotation of the various tails over the last 10 weeks.

The rotation for these size segments shows characteristics similar to those we have seen in growth and value. Large caps have predominantly been on the right-hand positive side of the graph, while mid- and small caps were positioned on the left-hand negative side of the RRG.
Here also, a countertrend move was traced out since mid-March, when mid- and small-caps turned to a positive heading at large-caps’ expense. Over the last few weeks, this counter-trend move has ended, and the outperformance for large caps is back in full swing.
Combining Style & Size
By splitting the growth and value segments into their respective size segments, we can see a more granular rotation that combines the two ways of dividing the stock market on one RRG.

Now things are getting interesting. Out of the six tails on the graph, only ONE is inside the leading quadrant and moving at a positive RRG-Heading. All other tales are traveling in a negative heading.
The strongest negative rotations are found for mid- and small-cap growth stocks. Both tails are further into the lagging quadrant in an almost straight line. A clear offset against the positive rotation for large-cap growth stocks.
The value tails across all size segments have rolled over, and they are now all rotating back toward the lagging quadrant after a brief stint through improving.
These rotations indicate that currently, only one market segment is traveling at a positive RRG heading, which is a large gap in growth stocks.
Although this segment contains all the biggest market-cap names, it also inhibits a risk as the base is very narrow.
Chart-by-Chart

Simply plotting all the price charts of these six segments under each other reveals that ONLY large-cap growth has surpassed the late March peak where all charts lined up.
And changing the price bars to relative lines (vs. $DJUS) makes things even clearer.

The Only Pocket of Strength Left
As always, price pays, or in terms of RRG; You must check the price chart before making any decisions.

Despite the still visible uptrend, the build-up of negative divergences between price and RSI / PPO keeps me alert. This type of setup usually occurs at the end of a trend and signals, at least, a pause in that trend or a reversal.
The only caveat is that we need to get a confirmation in the price chart in the form of a break of support, completion of a top formation, etc. And that has not happened yet.
So, The music is still playing, but the noise from outside of people leaving the party is getting louder.
#StayAlert, have a great weekend. –Julius