


As the name suggests, Dual Momentum Rotation Strategies focus on stocks that are in absolute and relative uptrends. This is a two-step process. First, filter out stocks that are in long-term downtrends and only focus on stocks in uptrend. Second, rank the stocks by a performance indicator and focus on the strongest. Note that TrendInvestorPro runs two Dual Momentum Rotation Strategies.
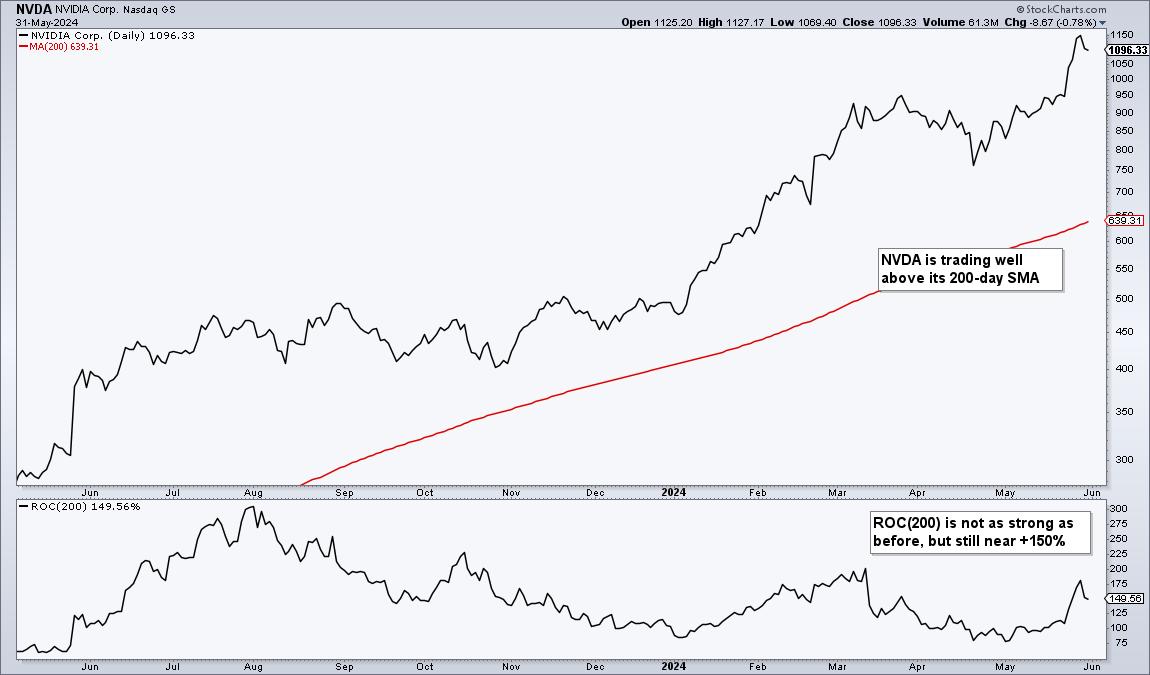
Traditional trend-following indicators, such as the 200-day SMA, measure absolute momentum. For example, a stock is in a long-term uptrend when above its 200-day SMA. Stocks trading below their 200-day SMAs are in long-term downtrends and do not make the cut for the second step.

For stocks in long-term uptrends, chartists can then quantify performance using the 200-day Rate-of-Change and comparing values to find the strongest. A stock with a 49% Rate-of-Change is stronger than a stock with a 19% Rate-of-Change.
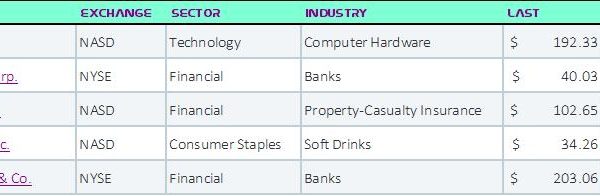
The image below shows CandleGlance charts for the top Nasdaq 100 stocks. They are ranked by the 200-day Rate-of-Change (ROC(200)). “Add indicator” is Rate-of-Change 200 and “Sort by Indicator” is Descending (red outline). These 12 are also above their 200-day SMAs (red lines) and in long-term uptrends.

As the green ovals show, Nvidia (NVDA), Crowdstrike (CRWD) and Constellation (CEG) are up over 100% the last 200 days and the other nine are up 50% or more. Chartists running a Dual Momentum Rotation Strategy would be focused on these leading names when constructing a portfolio. Strength begets strength.
We use a similar process for our Dual Momentum Rotation Strategies at TrendInvestorPro. Instead of raw Rate-of-Change, we use a volatility-adjust version to level the playing field. NVDA, CRWD and CEG are part of the current portfolio for the Nasdaq 100 strategy. We also have a separate strategy for S&P 500 stocks. Both strategies are off to a great start this year and you can view full performance metrics here.
///////////////////////////////////